TriniTuner.com | Latest Event:


Moderator: 3ne2nr Mods

Lol. IDK where to begin with that one yes.
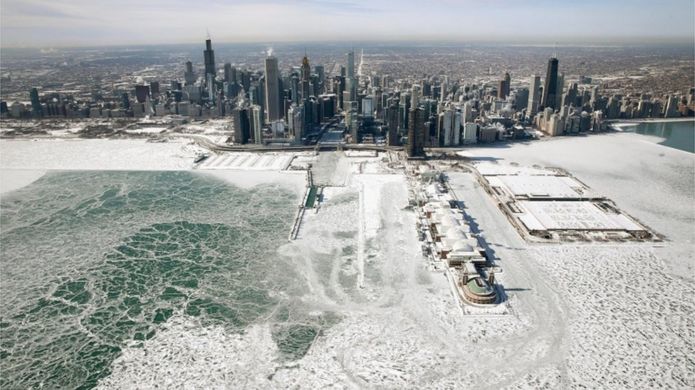
Polar vortex death toll rises to 21 as US cold snap continues
At least 21 people have died in one of the worst cold snaps to hit the US Midwest in decades.
Ninety million people - a third of the US - have seen temperatures of -17C (0F) or below. Some 250 million Americans overall have experienced the "polar vortex" conditions.
Hospitals have been treating patients reporting frostbite as parts of the country ground to a halt.
Temperatures are expected to swing to above average over the weekend.
Miktay wrote:Yep. It sure iz getting warmer.
"Winter storms don't prove that global warming isn't happening," NOAA tweeted, linking to a 2015 Climate.gov article that explains how warmer temperatures cause an increase in evaporation that in turn creates a wetter atmosphere and results in more rain and snow.
In a statement to CBS News, the Maryland-headquartered agency explained that the tweet was more of a regularly scheduled alert. "[It's] something NOAA routinely puts out when we get an extreme cold snap such as the one we're in now," a spokesperson said.
https://www.climate.gov/news-features/c ... -happening
Miktay wrote:Yep. It sure iz getting warmer.Polar vortex death toll rises to 21 as US cold snap continues
At least 21 people have died in one of the worst cold snaps to hit the US Midwest in decades.
Ninety million people - a third of the US - have seen temperatures of -17C (0F) or below. Some 250 million Americans overall have experienced the "polar vortex" conditions.
Hospitals have been treating patients reporting frostbite as parts of the country ground to a halt.
Temperatures are expected to swing to above average over the weekend.
https://www.bbc.com/news/amp/world-us-canada-47088684
adnj wrote:The big picture: Studies show that what happens in the Arctic does not stay in the Arctic, and rapid Arctic warming may paradoxically be leading to more frequent cold weather outbreaks in Europe, Asia and North America, particularly later in the winter.
How it works: The possible changes are being triggered by a sudden and drastic warming of the air in the stratosphere, some 100,000 feet above the Arctic, and by a resulting disruption of the polar vortex — an area of low pressure at high altitudes near the pole that, when disrupted, can wobble like a spinning top and send cold air to the south. In this case, it could split into three pieces, and those pieces would determine who gets hit the hardest.
https://www.axios.com/polar-vortex-is-about-to-split-up-5c2e7460-67fb-49da-b73a-079ffbe205b9.htmlMiktay wrote:Yep. It sure iz getting warmer.
.Here's The Real Connection Between The Brutal Polar Vortex And Global Warming
A record-breaking cold wave is sending literal shivers down the spines of millions of Americans.
Temperatures across the upper Midwest are forecast to fall an astonishing 50 degrees Fahrenheit (28 degrees Celsius) below normal this week – as low as 35°F below zero. Pile a gusty wind on top, and the air will feel like -60°F (-50°C)...
...Splits in the stratospheric polar vortex do happen naturally, but should we expect to see them more often thanks to climate change and rapid Arctic warming? It is possible that these cold intrusions could become a more regular winter story.
This is a hot research topic and is by no means settled, but a handful of studies offer compelling evidence that the stratospheric polar vortex is changing, and that this trend can explain bouts of unusually cold winter weather
Miktay wrote:adnj wrote:The big picture: Studies show that what happens in the Arctic does not stay in the Arctic, and rapid Arctic warming may paradoxically be leading to more frequent cold weather outbreaks in Europe, Asia and North America, particularly later in the winter.
How it works: The possible changes are being triggered by a sudden and drastic warming of the air in the stratosphere, some 100,000 feet above the Arctic, and by a resulting disruption of the polar vortex — an area of low pressure at high altitudes near the pole that, when disrupted, can wobble like a spinning top and send cold air to the south. In this case, it could split into three pieces, and those pieces would determine who gets hit the hardest.
https://www.axios.com/polar-vortex-is-about-to-split-up-5c2e7460-67fb-49da-b73a-079ffbe205b9.htmlMiktay wrote:Yep. It sure iz getting warmer.
If u believe thiz then I have a bridge in Mayaro to sell yuh.
Man made global warming iz a popular meme. But thus far it remains an untested theory. That includes the prediction that we will have colder weather from global warming.
So here's the essential issue. How do scientists tell the difference b/t a man made global warming polar vortex and a naturally occurring polar vortex?.Here's The Real Connection Between The Brutal Polar Vortex And Global Warming
A record-breaking cold wave is sending literal shivers down the spines of millions of Americans.
Temperatures across the upper Midwest are forecast to fall an astonishing 50 degrees Fahrenheit (28 degrees Celsius) below normal this week – as low as 35°F below zero. Pile a gusty wind on top, and the air will feel like -60°F (-50°C)...
...Splits in the stratospheric polar vortex do happen naturally, but should we expect to see them more often thanks to climate change and rapid Arctic warming? It is possible that these cold intrusions could become a more regular winter story.
This is a hot research topic and is by no means settled, but a handful of studies offer compelling evidence that the stratospheric polar vortex is changing, and that this trend can explain bouts of unusually cold winter weather
https://www.sciencealert.com/here-s-how ... al-warming
Slartibartfast wrote:Miktay wrote:Yep. It sure iz getting warmer.Polar vortex death toll rises to 21 as US cold snap continues
At least 21 people have died in one of the worst cold snaps to hit the US Midwest in decades.
Ninety million people - a third of the US - have seen temperatures of -17C (0F) or below. Some 250 million Americans overall have experienced the "polar vortex" conditions.
Hospitals have been treating patients reporting frostbite as parts of the country ground to a halt.
Temperatures are expected to swing to above average over the weekend.
https://www.bbc.com/news/amp/world-us-canada-47088684
Do you know what thae word "global" means?
Showing on spot where the temperature has dropped proved nothing. It's also referred to as climate change for a reason. The warming is changing weather patterns which means some places will be colder but on average the globe will be warmer.
Slartibartfast wrote:Miktay wrote:adnj wrote:The big picture: Studies show that what happens in the Arctic does not stay in the Arctic, and rapid Arctic warming may paradoxically be leading to more frequent cold weather outbreaks in Europe, Asia and North America, particularly later in the winter.
How it works: The possible changes are being triggered by a sudden and drastic warming of the air in the stratosphere, some 100,000 feet above the Arctic, and by a resulting disruption of the polar vortex — an area of low pressure at high altitudes near the pole that, when disrupted, can wobble like a spinning top and send cold air to the south. In this case, it could split into three pieces, and those pieces would determine who gets hit the hardest.
https://www.axios.com/polar-vortex-is-about-to-split-up-5c2e7460-67fb-49da-b73a-079ffbe205b9.htmlMiktay wrote:Yep. It sure iz getting warmer.
If u believe thiz then I have a bridge in Mayaro to sell yuh.
Man made global warming iz a popular meme. But thus far it remains an untested theory. That includes the prediction that we will have colder weather from global warming.
So here's the essential issue. How do scientists tell the difference b/t a man made global warming polar vortex and a naturally occurring polar vortex?.Here's The Real Connection Between The Brutal Polar Vortex And Global Warming
A record-breaking cold wave is sending literal shivers down the spines of millions of Americans.
Temperatures across the upper Midwest are forecast to fall an astonishing 50 degrees Fahrenheit (28 degrees Celsius) below normal this week – as low as 35°F below zero. Pile a gusty wind on top, and the air will feel like -60°F (-50°C)...
...Splits in the stratospheric polar vortex do happen naturally, but should we expect to see them more often thanks to climate change and rapid Arctic warming? It is possible that these cold intrusions could become a more regular winter story.
This is a hot research topic and is by no means settled, but a handful of studies offer compelling evidence that the stratospheric polar vortex is changing, and that this trend can explain bouts of unusually cold winter weather
https://www.sciencealert.com/here-s-how ... al-warming
So this article says that it may be due to global warming but they are not sure? How is this disproof of global warming?
Miktay wrote:The theory has to prove itself. Otherwise it remains a theory.
And that iz where it iz today. A theory with plenty speculation...rumor...innuendo and ole talk.
But no proof. No experiments. No substantial scientific evidence.
l33t2 wrote::oops:
adnj wrote:Global warming is a phenomenon. The theoretical portion is whether it is a partially (or wholly) a consequence of green house gas release due to human activity.
Once again, why it is happening is not so much the issue. The fact that it is happening is.
This.maj. tom wrote:Apparently dey fadda own ah oil rig. So they does talk like if it personal.
Slartibartfast wrote:Miktay wrote:The theory has to prove itself. Otherwise it remains a theory.
And that iz where it iz today. A theory with plenty speculation...rumor...innuendo and ole talk.
But no proof. No experiments. No substantial scientific evidence.
Proof was presented above (see quoted graph below).l33t2 wrote::oops:
If you do not consider this proof, why not? Also, what criteria do you "proof" to satisfy?
You need "expected results" for any experiment that you plan to do. So what type of experiment are you looking for and what sort of expected results would you need to see to confirm (in your view) the theory of Global Warming?
Edit: FYI, "A scientific theory is a well-substantiated explanation of some aspect of the natural world, based on a body of facts that have been repeatedly confirmed through observation and experiment. Such fact-supported theories are not "guesses" but reliable accounts of the real world." - From Wikipedia. For what it's worth, I think global warming may be considered a phenomenon and not a theory. But anyway, that's semantics and not really that relevant. Just wanted to point out that calling something a scientific theory does not mean the same thing as when you say you have a "theory" about random stuff like why crime so high in trinidad.
All of your questions can be answered by researching it online and verified once you take the time to look. Remember that just because you close your eyes to the information does not mean that it is not there. Of course those things are not shown in the graph. It is a just one graph. It is one representation of one of the final conclusions of one of the observational exercises of global warming. There is already a load of information packed into that tiny graph. I hope you didn't expect one graph to provide all the answers and proof for global warming.Miktay wrote:
That graph shows global temperatures have risen by a little less than 1 degree C over a little more than a century. Fair enuf.
Heres are a few important things we cant infer from the graph.
1. It doesnt state WHY temperatures are increasing.
2. It doesnt state HOW average global temperature iz measured. Thiz iz important because the assumption iz that such a critical thing as average global temperature can be measured accurately over 130 years
3. It doesnt state WHAT the ideal temperature of the planet should be.
4. It doesnts state WHAT iz causing the temperature increase.
5. It doesnt COMPARE the past 130 years to the previous 130 years or other time frame so we have a basis for comparison
And finally there iz no inference that man made global warming iz causing the temperature increase.
So that graph...if accurate...iz the beginning of the scientific process.
It iz not conclusive. It doenst prove anything.
Why Global Warming wrote:These increases in greenhouse gas concentrations and their marked rate of change are largely attributable to human activities since the Industrial Revolution (1800).
How is Global Warming Measured wrote:To calculate a global average temperature, scientists begin with temperature measurements taken at locations around the globe. Because their goal is to track changes in temperature, measurements are converted from absolute temperature readings to temperature anomalies—the difference between the observed temperature and the long-term average temperature for each location and date. Multiple independent research groups across the world perform their own analysis of the surface temperature data, and they all show a similar upward trend.
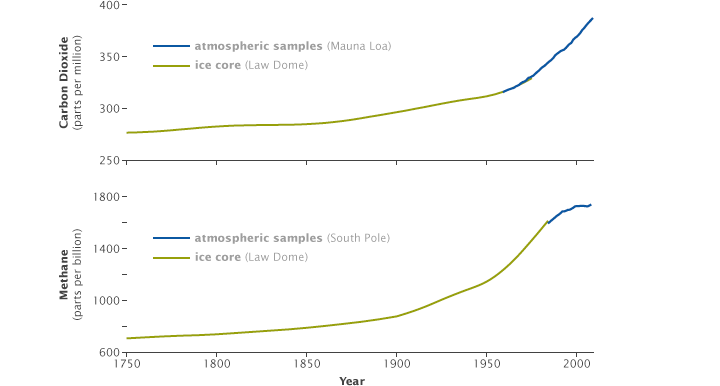
Increases in concentrations of carbon dioxide (top) and methane (bottom) coincided with the start of the Industrial Revolution in about 1750. Measurements from Antarctic ice cores (green lines) combined with direct atmospheric measurements (blue lines) show the increase of both gases over time. (NASA graphs by Robert Simmon, based on data from the NOAA

All of your questions can be answered by researching it online and verified once you take the time to look.
Remember that just because you close your eyes to the information does not mean that it is not there. Of course those things are not shown in the graph. It is a just one graph. It is one representation of one of the final conclusions of one of the observational exercises of global warming. There is already a load of information packed into that tiny graph. I hope you didn't expect one graph to provide all the answers and proof for global warming.
To calculate a global average temperature, scientists begin with temperature measurements taken at locations around the globe. Because their goal is to track changes in temperature, measurements are converted from absolute temperature readings to temperature anomalies—the difference between the observed temperature and the long-term average temperature for each location and date. Multiple independent research groups across the world perform their own analysis of the surface temperature data, and they all show a similar upward trend.
And again, what exactly are your expectations. The original temperature graph shows the observations being repeated by several independent scientific bodies all over the world and coming to a similar conclusion. At least give me an example of what you would consider a relevant experiment so I know what you are looking for.Again. Where are the repeatable experiments that support the Global Warming Theory? Where are the validated predictions?
What do you understand about greenhouse gases?Remember that just because you close your eyes to the information does not mean that it is not there. Of course those things are not shown in the graph. It is a just one graph. It is one representation of one of the final conclusions of one of the observational exercises of global warming. There is already a load of information packed into that tiny graph. I hope you didn't expect one graph to provide all the answers and proof for global warming.
You cant fit a theory to the data. That iz not science. That iz speculation.
Human beings are fallible. Because we believe something iz so does not make it so.
That iz why the scientific process exists: to separate verifiable facts from untested feelings and imagination.
Remember, the final result is global temperature variance. Not global temperature. Installing more thermometers is one way to control for errors. Your method of analyzing the data is another way. Letting separate groups analyse the data is another way.To calculate a global average temperature, scientists begin with temperature measurements taken at locations around the globe. Because their goal is to track changes in temperature, measurements are converted from absolute temperature readings to temperature anomalies—the difference between the observed temperature and the long-term average temperature for each location and date. Multiple independent research groups across the world perform their own analysis of the surface temperature data, and they all show a similar upward trend.
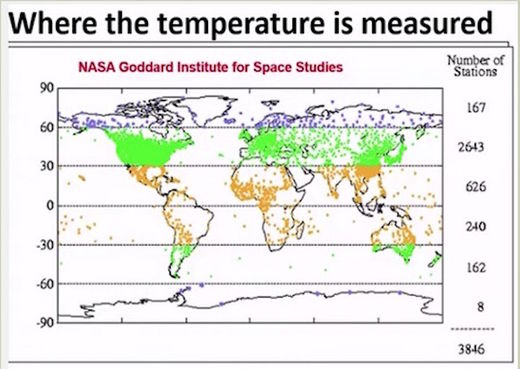
Per NASA Goddard Thiz iza recent distribution of thermometers used to determine global temperatures.
1. How are global temperatures accurately determined with thiz distribution. It iz heavily skewed. There are only 8 datapoints in the coldest part of the planet: the Antarctic.
2. Thermometer design has changed since 1890 (obviously). So how does credible science extrapolate average global temperature within 1 degree across 130 years ? There would have been larger margins of error for mecury thermometers in the early 1900s to current instruments.
It appears that regardless of how much data or proof is presented to you, your go to response it that it is not enough but you seem unable to state what would be acceptable as proof. So tell me, exactly what information will you like to see or what are the criteria that you will like met? Tell me what would be considered "good enough" for each of the concerns you raised there.
Optical Clocks and Relativity
C. W. Chou*, D. B. Hume, T. Rosenband, D. J. Wineland
Observers in relative motion or at different gravitational potentials measure disparate clock rates. These predictions of relativity have previously been observed with atomic clocks at high velocities and with large changes in elevation. We observed time dilation from relative speeds of less than 10 meters per second by comparing two optical atomic clocks connected by a 75-meter length of optical fiber. We can now also detect time dilation due to a change in height near Earth’s surface of less than 1 meter. This technique may be extended to the field of geodesy, with applications in geophysics and hydrology as well as in space-based tests of fundamental physics.
Slartibartfast wrote:adnj wrote:Global warming is a phenomenon. The theoretical portion is whether it is a partially (or wholly) a consequence of green house gas release due to human activity.
Once again, why it is happening is not so much the issue. The fact that it is happening is.
My thing is even if it wasn't happening, let's say that climate change is false and it's one big conspiracy; why try to put off the switch to renewable energy? Fossil fuels is a finite resource and petroleum is used for a lot of other very valuable products other than just energy.
We have the technology not to smoothly transfer most of our energy consumption to renewable energy. That way fossil fuel can be saved for places where it is harder to replace, like shipping and air travel. What is the alternative that climate change deniers are hoping for?
maj. tom wrote:Apparently dey fadda own ah oil rig. So they does talk like if it personal.
Miktay wrote:Slartibartfast wrote:Miktay wrote:The theory has to prove itself. Otherwise it remains a theory.
And that iz where it iz today. A theory with plenty speculation...rumor...innuendo and ole talk.
But no proof. No experiments. No substantial scientific evidence.
Proof was presented above (see quoted graph below).l33t2 wrote::oops:
If you do not consider this proof, why not? Also, what criteria do you "proof" to satisfy?
You need "expected results" for any experiment that you plan to do. So what type of experiment are you looking for and what sort of expected results would you need to see to confirm (in your view) the theory of Global Warming?
Edit: FYI, "A scientific theory is a well-substantiated explanation of some aspect of the natural world, based on a body of facts that have been repeatedly confirmed through observation and experiment. Such fact-supported theories are not "guesses" but reliable accounts of the real world." - From Wikipedia. For what it's worth, I think global warming may be considered a phenomenon and not a theory. But anyway, that's semantics and not really that relevant. Just wanted to point out that calling something a scientific theory does not mean the same thing as when you say you have a "theory" about random stuff like why crime so high in trinidad.
That graph shows global temperatures have risen by a little less than 1 degree C over a little more than a century. Fair enuf.
Heres are a few important things we cant infer from the graph.
It doesnt state WHY temperatures are increasing.
It doesnt state HOW average global temperature iz measured. Thiz iz important because the assumption iz that such a critical thing as average global temperature can be measured accurately over 130 years
It doesnt state WHAT the ideal temperature of the planet should be.
It doesnt COMPARE the past 130 years to the previous 130 years or other time frame so we have a basis for comparison
And finally there iz no inference that man made global warming iz causing the temperature increase.
So that graph...if accurate...iz the beginning of the scientific process...not the end.
There arent any scientific conclusions about global climate that can be drawn from that graph.
Miktay wrote:Thats how real science works. A body of validated and repeatable experiments support a theory from which u can make informed predictions.
Predictions are where the rubber meets the road. Predictions must bear the test of reality. Otherwise you have to revisit the theory.
Here iza citation from Science. It describes an experiment to test the time dilation prediction from the theory of Relativity.
Slartibartfast wrote:Miktay wrote:Thats how real science works. A body of validated and repeatable experiments support a theory from which u can make informed predictions...
It describes an experiment to test the time dilation prediction from the theory of Relativity.
"data" is such a vague blanket term that saying "data is not ....
I agree that prediction is what it is all about. This is a good point. So are you saying that if predictions are made about global warming and observations of global warming line up with those predictions that you would accept that as unequivocal proof? Are you saying that a prediction of global warming that observations were then later to confirm would be good enough proof for you? If yes, what kind of a timeline are we looking at? Like a 10 year prediction? 20? Keep in mind that this is a very recent in terms of human history and you would therefore not get predictions like 30 or 40 years old. But this absence of evidence is not evidence of absence.
Also, side question, what temperature increase would you consider relevant because (correct me if I am wrong) but you don't see a 1-1.5 degree increase in temperature as meaning anything. But there must be some threshold. Is it 5 degrees? 10?
Return to “Ole talk and more Ole talk”
Users browsing this forum: No registered users and 138 guests